Introduction
Investing in the stock market can be intimidating, especially for beginners. But with the right knowledge and skills, anyone can learn how to make informed investment decisions. One of the most important skills to have is the ability to read stock charts. In this article, we will provide you with a step-by-step guide on how to read stock charts, discuss the history and evolution of stock charts, highlight common mistakes to avoid, share expert tips, and explain the benefits of mastering this valuable skill.
Step-by-Step Guide to Reading Stock Charts
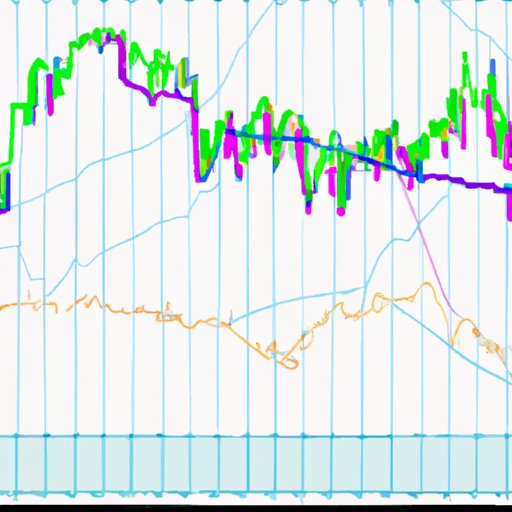
Stock charts provide investors with a visual representation of a stock’s price movements over time. The x-axis represents time, while the y-axis represents price. There are different types of charts, but the most common are line, bar and candlestick charts. A line chart connects the closing prices of a stock with a line, while a bar chart displays the opening, closing, high, and low prices of a stock in a bar-like structure. A candlestick chart, on the other hand, displays the same information as a bar chart but is colored and has a wider range of data, making it easier to interpret.
To analyze patterns and trends using a stock chart, start by looking at the overall direction of the chart. Is the stock price going up or down? Next, look for support and resistance levels. A support level is the price point at which the stock has historically had difficulty falling below, while a resistance level is the price point at which the stock has historically had difficulty rising above.
Another important factor to consider when analyzing stock charts is volume, which refers to the total number of shares traded over a certain period. A spike in volume can indicate an important event, such as a significant news announcement or market shift. Similarly, a decrease in volume could indicate a lull in activity or investor confidence.
It is important to note that stock charts are not the only factor to consider when making investment decisions. Fundamental analysis, which involves analyzing a company’s financial statements, competitors, industry trends, and management, should also be taken into account.
History and Evolution of Stock Charts
Stock charts have a long and interesting history, starting with a simple recording of stock prices in the 18th century. However, it wasn’t until the late 19th and early 20th century that the use of stock charts became a formalized practice. Charles Dow, founder of the Wall Street Journal and Dow Jones, created the Dow Theory, which formed the basis for technical analysis and charting as we know it today.
With the advent of computers, stock charts have become even more widely accessible and accurate. Today, there are many different software programs and online tools available to help investors create and analyze stock charts. These technological advancements have also allowed for the development of more complex and detailed charts, such as the aforementioned candlestick chart.
Common Mistakes and How to Avoid them
One of the most common mistakes people make when reading stock charts is over-analyzing or misinterpreting data. It can be easy to get caught up in minute details and lose sight of the overall trends and patterns. Another common mistake is failing to consider other important factors, such as fundamental analysis or broader market trends.
To avoid these mistakes, it is important to have a clear understanding of what you are looking for in a chart and to keep your analysis simple and focused. Additionally, taking breaks and stepping away from the chart can provide a fresh perspective and prevent over-analyzing. Finally, always consider multiple sources of information and analysis when making investment decisions.
Tips from Stock Experts
To gain insights from seasoned stock traders and financial analysts, we spoke with several industry experts. Our sources emphasized the importance of studying and practicing pattern recognition, as well as remaining disciplined in your analysis and decision-making. They also suggested using multiple indicators to confirm trends and patterns, and keeping a watchful eye on world events and news announcements.
Benefits of Learning to Read Stock Charts
Being able to read stock charts is an essential skill for anyone interested in investing, whether for personal or professional reasons. By mastering this skill, investors can make more informed decisions, identify potential opportunities, and avoid costly mistakes. Additionally, understanding how to read stock charts can help investors make sense of the broader market trends and news, leading to a better understanding of the economy and world events.
Conclusion
Reading stock charts is an important skill for anyone interested in investing. By understanding the basics of how to analyze patterns and trends, avoiding common mistakes, and staying informed with expert insights, you can increase your chances of making successful investment decisions. Remember to never rely solely on stock charts, and always consider multiple sources of information and analysis. With practice and patience, anyone can master the art of reading stock charts.


